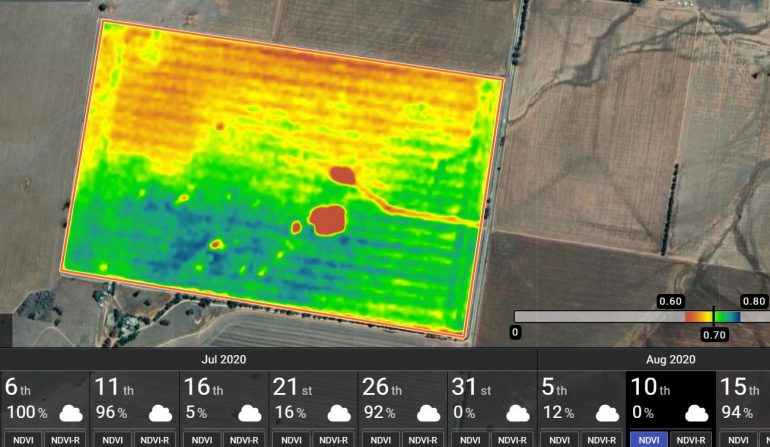
This time of year means canola starts flowering. This is a big issue for NDVI calculations, as the yellow flowers disrupt the readings significantly.
The example below shows a crop starting to flower last week. The colour and NDVI images below show that the areas flowering the most (which are probably the best parts of the paddock) actually show the lowest NDVI readings. For those who want the technical details on why this occurs, the yellow flowers reflect more red light and less NIR light, which causes the NDVI to fall. Both red and NIR bands are used in NDVI calculations. In addition to this, the flowers cover the leaves so we can’t physically see them from above.

As ever, don’t hesitate to get in touch if we can be of assistance. If you need software support, support@datafarming.com.au is available to you. If you are having troubles with boundary uploads then please email them to support and we will fix them for you – at no charge (we want you to be getting value from the platform!)
All the best,
Tim and Peta Neale and the whole team