Our new High Resolution Images tool has today been launched, and is ready to provide sub 1-metre satellite captures of your crops.
Ideal for monitoring crop variability, and irrigation and fertiliser performance down to row or tree level, high resolution satellite imagery can detect issues that are tough to spot at ground-level. High resolution satellite imagery can be used to:
- Instantly target issues during critical periods at a resolution suited to intensive permanent cropping
- Pinpoint on-ground issues before scouting and tissue sampling
- Monitor and track crop vigour
- Save time and costs knowing where to sample, and target fertiliser and water applications
- See detail down to an individual row or tree in an orchard
- See machinery impacts on crop productionS
- Observe trial strips
- See finer detail which helps explain the causes of variability
- See smaller features such as drains, roads and field boundaries
- Pick up fine-scale disease outbreaks (often before they can be detected in the field)
- See nutrient striping from poor spreader applications
How do you interpret high resolution satellite imagery?
As demonstrated in the below images, high resolution satellite imagery shows your NDVI (normalised difference vegetation index) and PCD (Plant Cell Density) on any given day. These are markers of crop vigour and health. The higher the NDVI or PCD, the greater the vigour and health of the plant ortree. Colours are deliberately stretched to allow you to pinpoint good (blue), fair (yellow) and poor performing areas (red) that the naked eye often can’t detect.
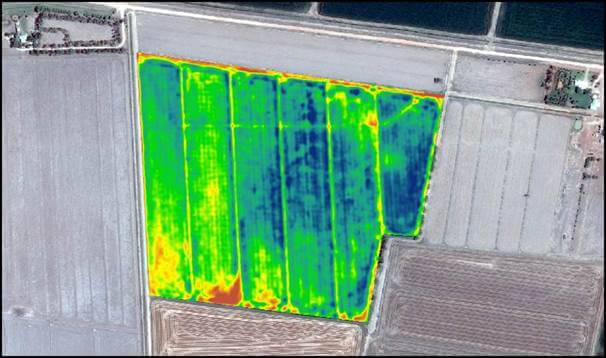
Above: High res satellite map showing NDVI
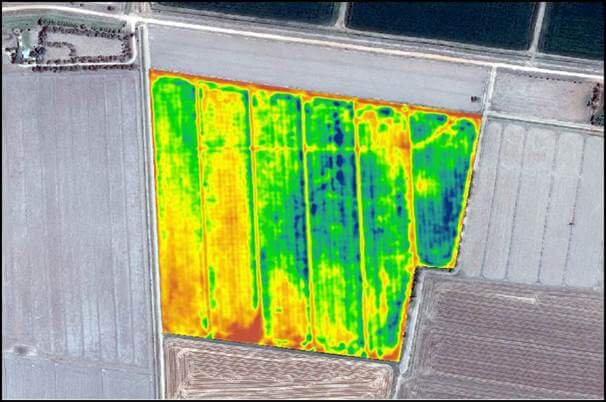
Above: High res satellite map showing PCD
As colours are a marker of crop performance on a particular day (not the overall season), a red spot does not necessarily indicate a ‘bad’ area or plant/tree – but it is a sign that you need to either monitor it or take some affirmative action. Low values may indicate poorer health and vigour due to:
- Nutrient deficiency
- Presence of disease/pests
- Poorer growing conditions (soil type/compaction, elevation and drainage)
- Frost/hail damage
Taking this one step further, you can get the most from these insights by combining high res with our Auto Zone tool, which is also part of the Digital Agronomist platform. Auto zone allows you to quickly and easily to generate variable rate application files that are compatible with most farm machinery systems (including John Deere, Case and Trimble). So your applications will apply the right level of seed or fertiliser in the right places – no more, no less.
High resolution imagery is being made available at $2 p/ha for a single capture and $10 p/ha for multiple captures. Once the order is placed, it typically takes 10-14 days before the satellite company will begin capturing images, so we encourage orders early in time for summer.
Get started by logging into our platform, opening your farm and selecting ‘Order high res images’ from the right-hand side of the screen. Please also take the time to review these frequently asked questions, as they provide some important information about on-demand satellite image capturing.
As always, get in touch via insights@datafarming.com.au if you have any questions!